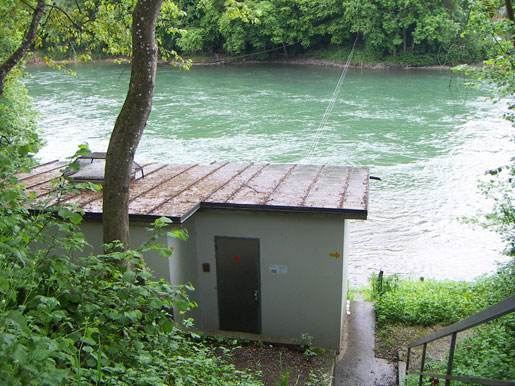
Aare - Murgenthal 2063
Discharge and Water level
|
Discharge
m³/s
|
Water level
m a.s.l.
|
|
|---|---|---|
|
Last reading
18.04.2026 12:20
|
223
|
398.98
|
| 24hr mean | 237 | 399.04 |
| 24hr maximum | 241 | 399.06 |
| 24hr minimum | 223 | 398.98 |
Danger levels
Discharge m³/s
- 5 > 1150
- 4 1050 - 1150
- 3 940 - 1050
- 2 720 - 940
- 1 < 720
Graphs
Regarding alerts, the statements as interpreted in the natural hazard bulletin on www.natural-hazards.ch are authoritative. The hydrological forecasts shown are direct model outputs. Explanatory notes on forecast plots
Data and statistics
Key figures Discharge
| Jan | Feb | Mar | Apr | May | Jun | Jul | Aug | Sep | Oct | Nov | Dec | |
|---|---|---|---|---|---|---|---|---|---|---|---|---|
| Monthly mean | 243 m³/s | 248 m³/s | 259 m³/s | 305 m³/s | 358 m³/s | 383 m³/s | 350 m³/s | 305 m³/s | 255 m³/s | 229 m³/s | 237 m³/s | 246 m³/s |
| Maximum reading |
908 m³/s
25.01.1995
|
878 m³/s
10.02.1977
|
1015 m³/s
12.03.1981
|
946 m³/s
10.04.2006
|
965 m³/s
04.05.2015
|
925 m³/s
26.06.1987
|
1025 m³/s
15.07.2021
|
1262 m³/s
09.08.2007
|
920 m³/s
22.09.1968
|
922 m³/s
15.10.1981
|
980 m³/s
23.11.1972
|
885 m³/s
13.12.2023
|
| Minimum daily mean value |
97 m³/s
01.01.1954
|
86 m³/s
13.02.1964
|
104 m³/s
16.03.1996
|
109 m³/s
21.04.2011
|
109 m³/s
10.05.2011
|
138 m³/s
04.06.1971
|
124 m³/s
12.07.2022
|
124 m³/s
22.08.1949
|
113 m³/s
29.09.1941
|
84 m³/s
09.10.1969
|
86 m³/s
19.11.1962
|
80 m³/s
03.12.1962
|
Annual mean
Highest
371 m³/s
1936
Lowest
179 m³/s
1976
Mean
285 m³/s
Total period
Station information
- Station altitude
- 403 m a.s.l.
- Catchment size
- 10059 km2
- Mean catchment altitude
- 1066 m a.s.l.
- Glacial area
- 1.700%
- Station coordinates
- 2'629'658 / 1'235'141