Explanatory notes on forecast plots
The example of hydrological forecasts for the station Rhône - Porte-du-Scex shows how to read forecast plots.
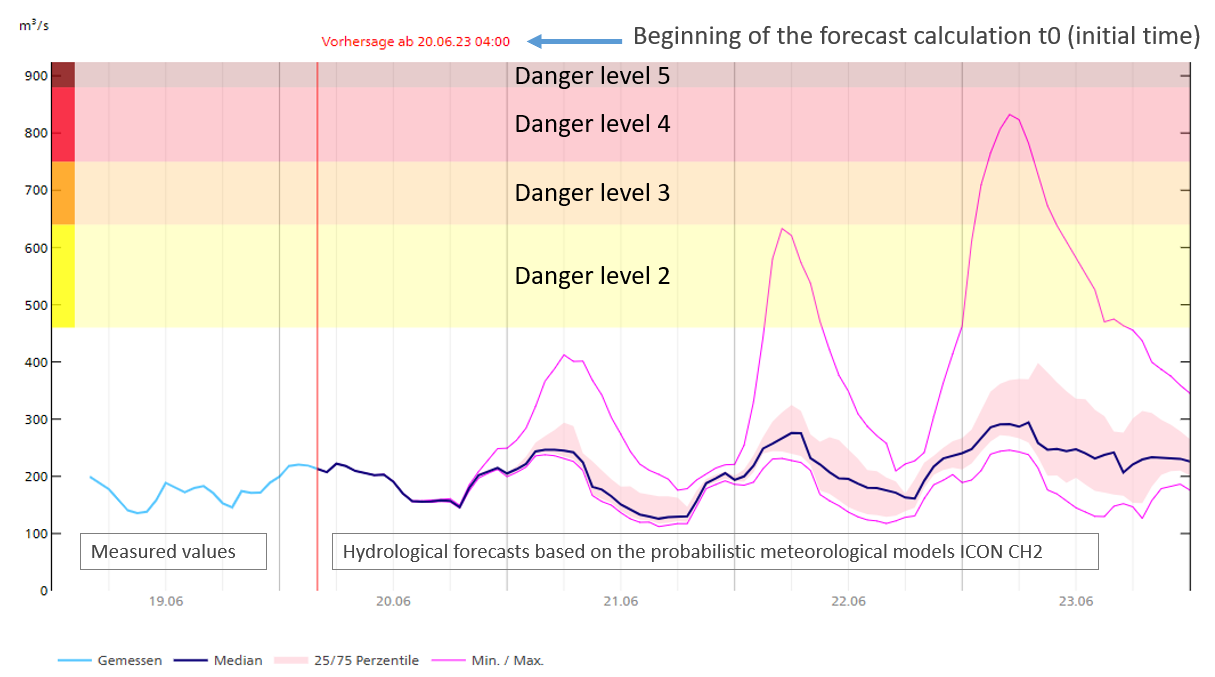
Explanatory notes on the legend:
- Measured: Discharge measured at the station
- Median: Median forecast among all 21 model outputs
- 25. - 27. percentiles: Range of model outputs above the lowest 25% and below the highest 25% of values.
- Min./Max.: Range between all maximum and minimum model outputs.
Further information:
More information about danger levels