
Linth - Linthal, Ausgleichsbecken KLL, nur Hauptstation 2352
Information
Dies ist eine Hauptstation. Abflussberechnung: Hauptstation (2352) + Nebenstation (2353) = Totalstation (0352)
Abfluss und Wasserstand
|
Abfluss
m³/s
|
Wasserstand
m ü.M.
|
|
|---|---|---|
|
Letzter Messwert
05.09.2026 08:30
|
2.9
|
668.54
|
| Mittelwert 24h | 2.8 | 668.54 |
| Maximum 24h | 3.4 | 668.57 |
| Minimum 24h | 2.1 | 668.49 |
Daten und Statistiken
Kennzahlen Abfluss
| Jan | Feb | Mär | Apr | Mai | Jun | Jul | Aug | Sep | Okt | Nov | Dez | |
|---|---|---|---|---|---|---|---|---|---|---|---|---|
| Monatsmittel | 1.7 m³/s | 1.6 m³/s | 2.0 m³/s | 3.5 m³/s | 6.5 m³/s | 8.7 m³/s | 7.8 m³/s | 6.8 m³/s | 5.1 m³/s | 4.1 m³/s | 2.6 m³/s | 1.9 m³/s |
| Maximaler Messwert |
28 m³/s
21.01.2015
|
15 m³/s
03.02.2020
|
50 m³/s
20.03.2002
|
61 m³/s
26.04.2016
|
73 m³/s
13.05.2016
|
82 m³/s
17.06.1991
|
103 m³/s
13.07.2011
|
168 m³/s
23.08.2005
|
91 m³/s
30.09.1991
|
88 m³/s
03.10.2020
|
50 m³/s
16.11.2002
|
35 m³/s
22.12.1991
|
| Minimales Tagesmittel |
0.432 m³/s
29.01.2006
|
0.427 m³/s
12.02.2006
|
0.57 m³/s
05.03.2006
|
0.92 m³/s
06.04.1996
|
1.3 m³/s
06.05.2012
|
3.4 m³/s
28.06.1996
|
2.3 m³/s
30.07.2003
|
2.2 m³/s
31.08.2011
|
1.4 m³/s
28.09.2006
|
0.83 m³/s
30.10.1999
|
0.53 m³/s
20.11.1999
|
0.464 m³/s
18.12.1999
|
Jahresmittel
Höchstes
7.5 m³/s
2016
Tiefstes
3.0 m³/s
1996
Mittelwert
4.4 m³/s
Gesamte Periode
Stationsinformationen
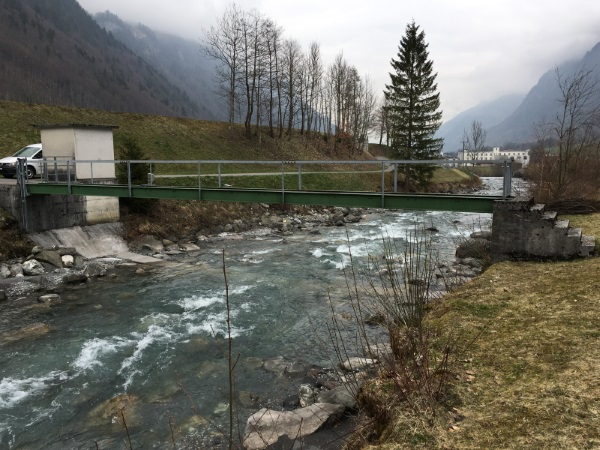
- Stationshöhe
- 671 m ü.M.
- Fläche des Einzugsgebiets
- 147 km2
- Mittlere Höhe des Einzugsgebiets
- 2085 m ü.M.
- Vergletscherung
- 9.40 %
- Koordinaten der Station
- 2'718'287 / 1'197'310