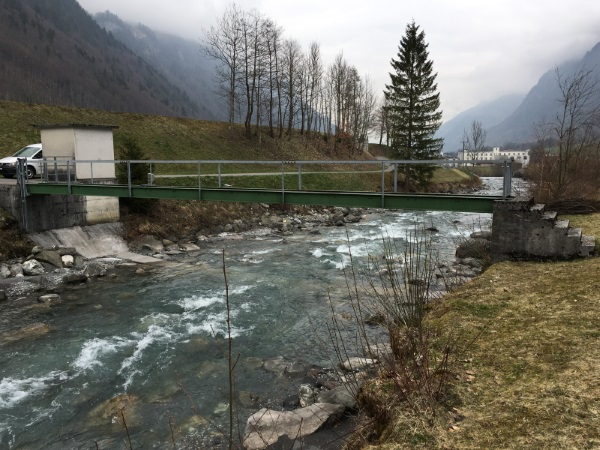
Linth - Linthal, Ausgleichsbecken KLL, nur Hauptstation 2352
Information
Dies ist eine Hauptstation. Abflussberechnung: Hauptstation (2352) + Nebenstation (2353) = Totalstation (0352)
Discharge and Water level
|
Discharge
m³/s
|
Water level
m a.s.l.
|
|
|---|---|---|
|
Last reading
|
0.81
14.01.2026 01:30
|
668.38
14.01.2026 03:20
|
| 24hr mean | 1.2 | 668.42 |
| 24hr maximum | 1.7 | 668.49 |
| 24hr minimum | 0.81 | 668.38 |
Data and statistics
Key figures Discharge
| Jan | Feb | Mar | Apr | May | Jun | Jul | Aug | Sep | Oct | Nov | Dec | |
|---|---|---|---|---|---|---|---|---|---|---|---|---|
| Monthly mean | 1.5 m³/s | 1.5 m³/s | 1.9 m³/s | 3.4 m³/s | 6.3 m³/s | 8.3 m³/s | 7.6 m³/s | 6.5 m³/s | 5.0 m³/s | 3.7 m³/s | 2.3 m³/s | 1.7 m³/s |
| Maximum reading |
28 m³/s
21.01.2015
|
44 m³/s
15.02.1990
|
50 m³/s
20.03.2002
|
61 m³/s
26.04.2016
|
73 m³/s
13.05.2016
|
82 m³/s
17.06.1991
|
109 m³/s
31.07.1977
|
168 m³/s
23.08.2005
|
143 m³/s
23.09.1981
|
88 m³/s
03.10.2020
|
50 m³/s
16.11.2002
|
35 m³/s
22.12.1991
|
| Minimum daily mean value |
0.013 m³/s
23.01.1990
|
0.371 m³/s
23.02.1983
|
0.57 m³/s
05.03.2006
|
0.92 m³/s
06.04.1996
|
1.3 m³/s
06.05.2012
|
2.7 m³/s
09.06.1989
|
2.3 m³/s
30.07.2003
|
2.2 m³/s
31.08.2011
|
1.4 m³/s
28.09.2006
|
0.55 m³/s
27.10.1983
|
0.378 m³/s
19.11.1984
|
0.365 m³/s
29.12.1981
|
Annual mean
Highest
7.5 m³/s
2016
Lowest
2.7 m³/s
1976
Mean
4.1 m³/s
Total period
Station information
- Station altitude
- 671 m a.s.l.
- Catchment size
- 147 km2
- Mean catchment altitude
- 2085 m a.s.l.
- Glacial area
- 9.400%
- Station coordinates
- 2'718'287 / 1'197'310