Ticino - Pollegio, Campagna 2494
Discharge and Water level
|
Discharge
m³/s
|
Water level
m a.s.l.
|
|
|---|---|---|
|
Last reading
23.01.2026 09:50
|
33
|
290.91
|
| 24hr mean | 17 | 290.73 |
| 24hr maximum | 37 | 290.95 |
| 24hr minimum | 5.4 | 290.55 |
Danger levels
Discharge m³/s
- 5 > 700
- 4 550 - 700
- 3 400 - 550
- 2 250 - 400
- 1 < 250
Graphs
Regarding alerts, the statements as interpreted in the natural hazard bulletin on www.natural-hazards.ch are authoritative. The hydrological forecasts shown are direct model outputs. Explanatory notes on forecast plots
Data and statistics
Key figures Discharge
| Jan | Feb | Mar | Apr | May | Jun | Jul | Aug | Sep | Oct | Nov | Dec | |
|---|---|---|---|---|---|---|---|---|---|---|---|---|
| Monthly mean | 12 m³/s | 12 m³/s | 12 m³/s | 16 m³/s | 28 m³/s | 34 m³/s | 27 m³/s | 19 m³/s | 19 m³/s | 23 m³/s | 20 m³/s | 14 m³/s |
| Maximum reading |
55 m³/s
12.01.2006
|
56 m³/s
14.02.2001
|
83 m³/s
09.03.1991
|
126 m³/s
18.04.2016
|
216 m³/s
19.05.1996
|
352 m³/s
17.06.2016
|
609 m³/s
19.07.1987
|
573 m³/s
01.09.1992
|
632 m³/s
01.09.1992
|
515 m³/s
03.10.2020
|
357 m³/s
16.11.2002
|
90 m³/s
19.12.1989
|
| Minimum daily mean value |
3.7 m³/s
18.01.1987
|
5.7 m³/s
03.02.2013
|
3.5 m³/s
31.03.2022
|
3.5 m³/s
18.04.2023
|
6.7 m³/s
15.05.2005
|
8.9 m³/s
19.06.2022
|
5.8 m³/s
30.07.2023
|
3.4 m³/s
28.08.2022
|
4.4 m³/s
01.09.2022
|
4.8 m³/s
29.10.2005
|
3.8 m³/s
01.11.1989
|
1.0 m³/s
17.12.1997
|
Annual mean
Highest
27 m³/s
1993
Lowest
11 m³/s
2022
Mean
20 m³/s
Total period
Station information
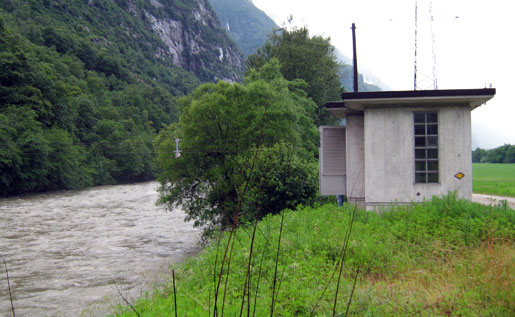
- Station altitude
- 295 m a.s.l.
- Catchment size
- 444 km2
- Mean catchment altitude
- 1796 m a.s.l.
- Glacial area
- 0.200%
- Station coordinates
- 2'716'163 / 1'135'318