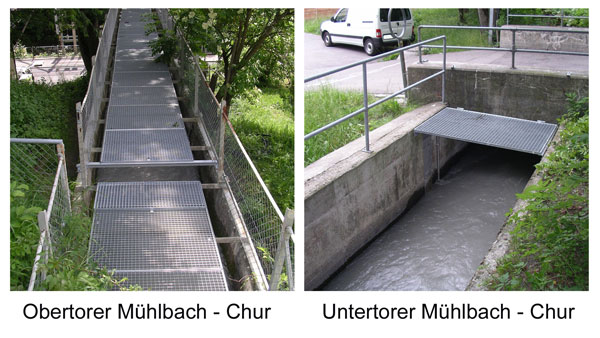
Untertorer Mühlbach - Chur, Kantonsschule 9632
Information
Dies ist eine Nebenstation. Abflussberechnung: Nebenstation (9632) + Nebenstation (2632) + Hauptstation (2185) = Totalstation (0185)
Discharge and Water level
|
Discharge
m³/s
|
Water level
m a.s.l.
|
|
|---|---|---|
|
Last reading
21.08.2025 16:50
|
1.1
|
4.70
|
| 24hr mean | 1.1 | 4.70 |
| 24hr maximum | 1.2 | 4.71 |
| 24hr minimum | 1.1 | 4.70 |
Data and statistics
Key figures Discharge
| Jan | Feb | Mar | Apr | May | Jun | Jul | Aug | Sep | Oct | Nov | Dec | |
|---|---|---|---|---|---|---|---|---|---|---|---|---|
| Monthly mean | 0.94 m³/s | 0.84 m³/s | 1.0 m³/s | 1.1 m³/s | 1.1 m³/s | 1.2 m³/s | 1.1 m³/s | 1.1 m³/s | 0.96 m³/s | 0.66 m³/s | 0.80 m³/s | 1.0 m³/s |
| Maximum reading |
1.5 m³/s
08.01.2013
|
2.2 m³/s
18.02.2017
|
1.5 m³/s
16.03.2018
|
1.6 m³/s
20.04.2018
|
1.6 m³/s
28.05.2018
|
1.6 m³/s
21.06.2017
|
1.8 m³/s
03.07.2017
|
1.7 m³/s
09.08.2013
|
1.5 m³/s
14.09.2012
|
1.7 m³/s
06.10.2014
|
1.5 m³/s
06.11.2013
|
1.5 m³/s
01.12.2013
|
| Minimum daily mean value |
0.000 m³/s
29.01.2019
|
0.000 m³/s
01.02.2019
|
0.000 m³/s
21.03.2023
|
0.000 m³/s
05.04.2022
|
0.000 m³/s
22.05.2018
|
0.000 m³/s
14.06.2023
|
0.000 m³/s
11.07.2016
|
0.000 m³/s
01.08.2016
|
0.000 m³/s
04.09.2018
|
0.000 m³/s
19.10.2023
|
0.000 m³/s
01.11.2023
|
0.000 m³/s
04.12.2016
|
Annual mean
Highest
1.3 m³/s
2013
Lowest
0.50 m³/s
2016
Mean
0.99 m³/s
Total period
Station information
- Station altitude
- 603 m a.s.l.
- Station coordinates
- 2'759'925 / 1'190'599